
In Trading view platform, we can easily plot lines using pine script programming code. In this post we gonna check how we can plot a horizontal line, add a title for that line.
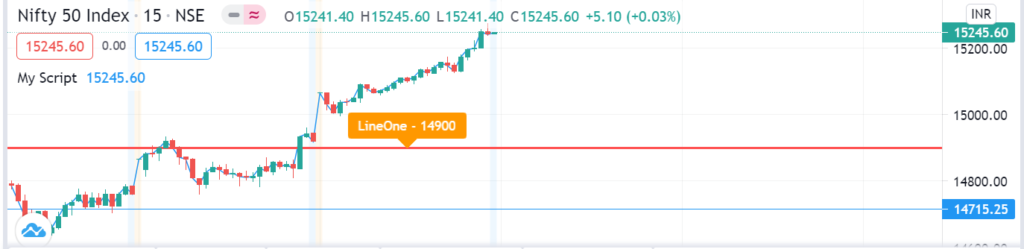
Here is how to plot a horizontal line at a price with a label for that line.
Pine Script – Horizontal Line Output
// This source code is subject to the terms of the Mozilla Public License 2.0 at https://mozilla.org/MPL/2.0/
// © smartcodehelper11

//@version=4
study("My Script", overlay=true)
var linePrice = 14900
hline(linePrice, title="Short Range Line", color=color.red, linestyle=hline.style_solid, linewidth=2)
myLabel = label.new(x=bar_index, y=high,
      color=color.orange, textcolor=color.white,
      style=label.style_labeldown)
label.set_text(id=myLabel, text="LineOne - "+ tostring(linePrice))
label.set_xy(myLabel,bar_index[13],linePrice)
label.delete(myLabel[1])

plot(close)
Pine Script Code – Horizontal Line with Title / Label
In the above code : var linePrice = 14900
we are creating a variable to store the price we want to plot.
Pine Script Code to Plot the line:
hline(linePrice, title="Short Range Line", color=color.red, linestyle=hline.style_solid, linewidth=2)
linePrice – Input price
title – title for the line(will not be shown)
Pine Script Code to Plot a Label Text:
myLabel = label.new(x=bar_index, y=high,
      color=color.orange, textcolor=color.white,
      style=label.style_labeldown)
label.set_text(id=myLabel, text="LineOne - "+ tostring(linePrice))
label.set_xy(myLabel,bar_index[13],linePrice)
label.delete(myLabel[1])
Thank you very much for sharing the script.
I need your advice.
Every time I run a script, the Trading View always says ” Active Chart Does not contain the study you are going to publish”
IT does not matter which Indices I am choosing.
I looked at various articles and videos.. but I am unable to proceed.
Request your kind help.